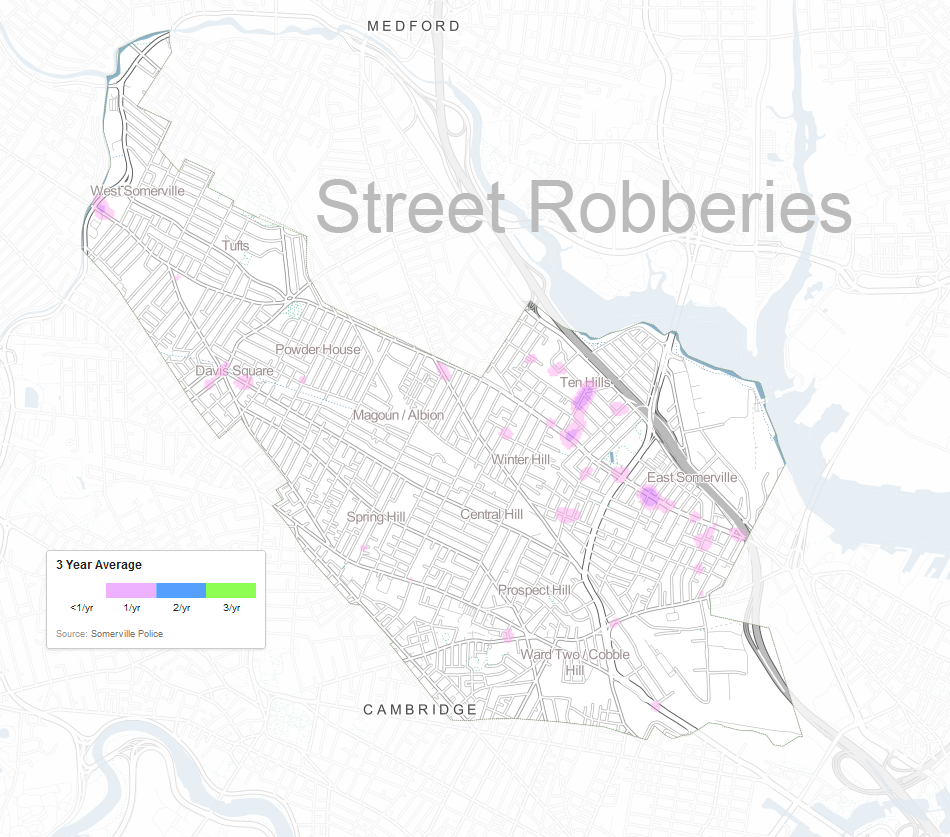
Street Robberies
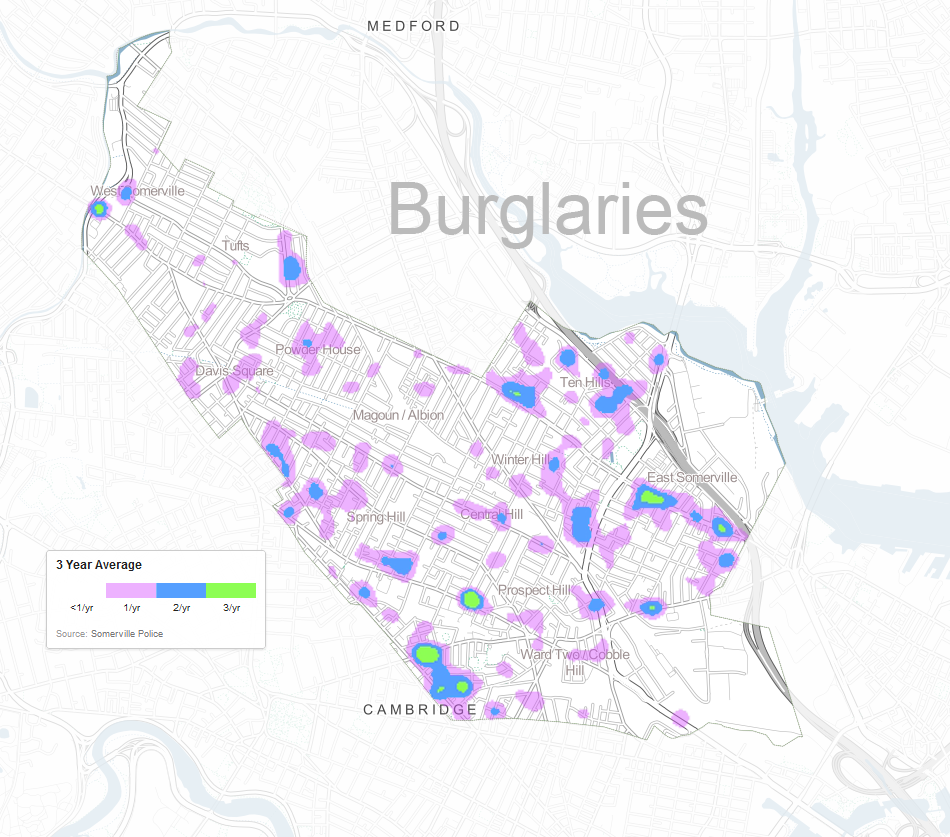
All Burglary
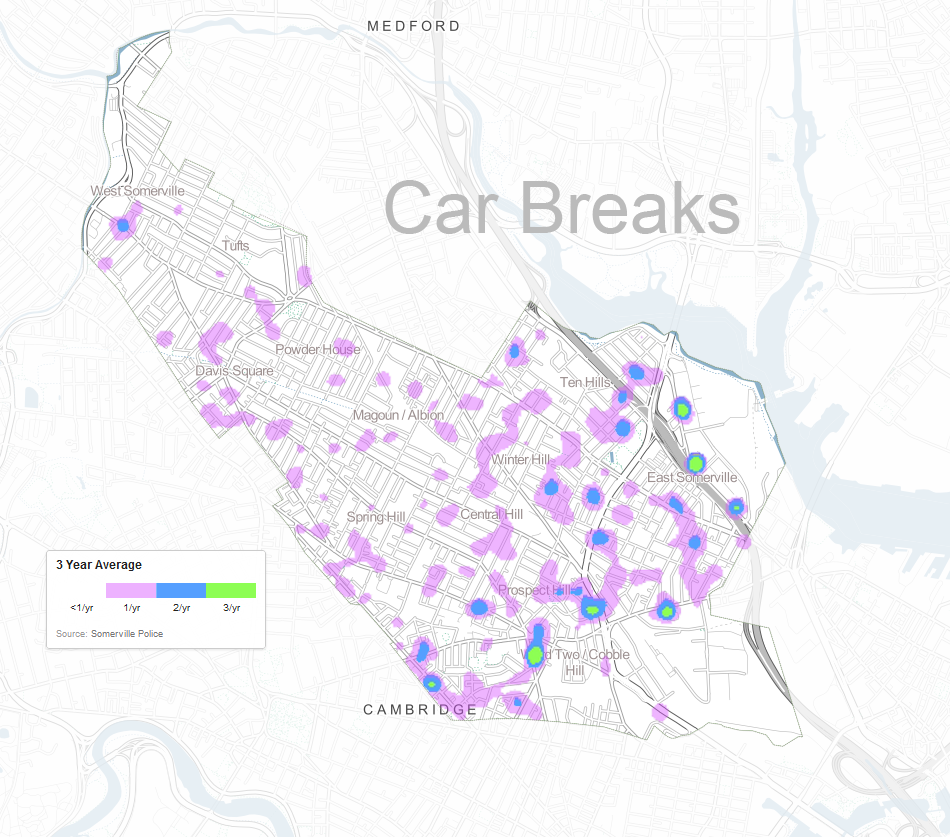
Car Breaks
The City of Somerville's Key Systems Indicators
Somerville made headlines when it became the first city in the country to measure wellbeing through a citywide survey in 2011. These charts show data from the 2015 survey, which demonstrated that city residents have a high degree of satisfaction, both with their personal lives and with Somerville as a place to live. The lowest average rating was given to the cost of housing, while the highest ratings were given for the City's social and community events and the availability of information about city services. Access the raw data here.
Crime in Somerville has dropped by roughly one third since 2008. This decline can be attributed to national trends (e.g., newer cars are more difficult to steal), the City's education and economic development initiatives, and the Police Department's efforts to use data-driven strategies to identify problems and deploy resources. The City saw an increase in reported larceny in 2015. The majority of this activity is shoplifting taking place in areas of increased commercial and retail development, like Assembly Square.
The Somerville Fire Department responds to around 13,000 calls each year. In 2015, medical calls accounted for nearly half (46%) of all calls. Since 2008, fire-related calls consistently make up only 3% of total calls. "Other Emergency" calls include issues like gas leaks, electrical or power problems, hazmat issues, etc. "Service" calls are non-emergency calls like assisting elderly or invalid residents, helping people locked out of their homes or getting cats out of trees.
This is a random sample of the top quality-of-life calls from the year 2015: reports of calls about graffiti, rats, and trash. It shows where these types of calls tend to cluster. We also track these on a weekly basis here.
Over 80 percent of calls to 311 are answered within 20 seconds. Many of these calls result in the creation of a work order for the Department of Public Works, which completes over 80 percent of its work orders on time. There is variation over the year, though, such as when heavy snow pushed the on-time completion rate in February 2013 down to 51 percent.
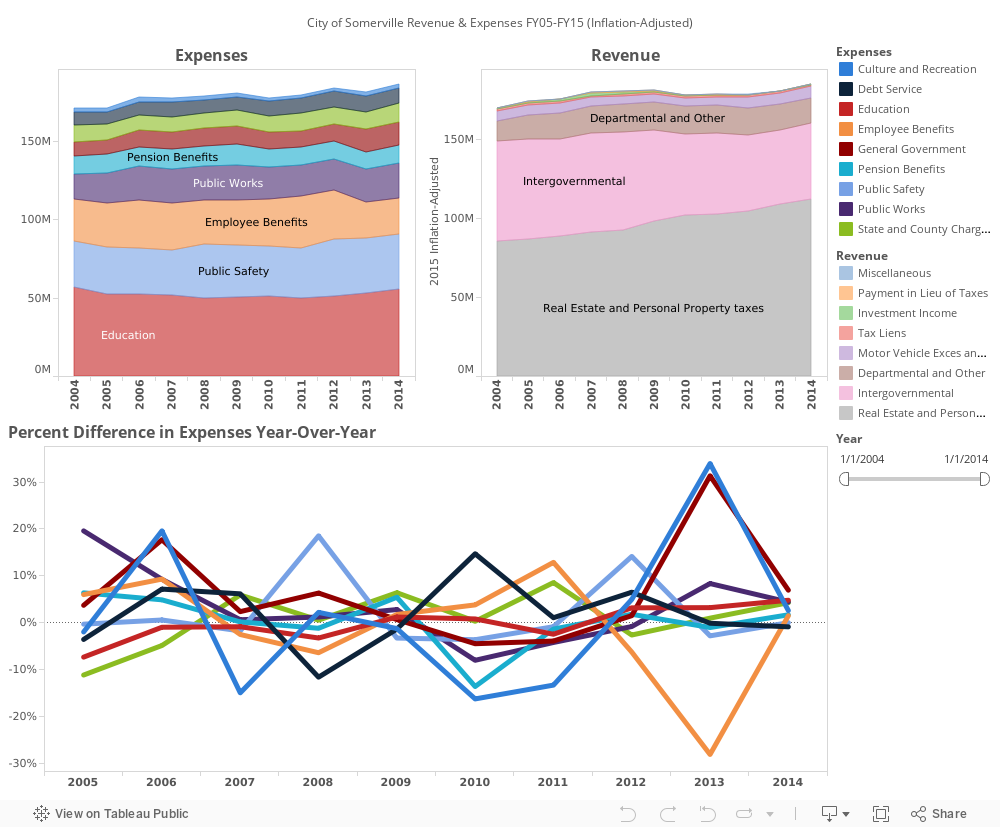
Somerville has some of the lowest property taxes in the metropolitan area when the residential exemption is factored in. The City has had to rely more on taxes as state aid has declined, but still maintains a generous exemption for residents. The largest categories of expenditures are the schools, public safety and works, and the pensions and benefits of employees.
Below is an historical view of Somerville's actual expenditures and revenue by category and adjusted for inflation. The Percent Difference chart displays year over year increases or decreases in funding for particular categories as a percentage of the prior year. Hover over a category to reveal exact amounts for each fiscal year and use the slider bar to change what years are displayed. Selecting a category will highlight it and reveal its corresponding trend line. Notable trends include the increased reliance on Property Tax for revenue over the past decade as well as an incredible 28% cost savings for Employee Benefits between FY12 and FY13 achieved through switching to Massachusetts Group Insurance Commission.
Proposed Green Line Extension